• XtraPivotGrid Suite是一个具有复杂的数据分析,数据采集以及为WindowForms应用程序提供可视化报表解决方案的控件。它是设计架构于On-screen到printed reports之间的独特桥梁。拥有它,你能根据他们的要求使用简单易懂的(easy-to-understand )Window命令并立即输出到打印机,你的用户能够划分未加工的数据。通过将XtraPivotGrid合并到你的应用程序中,你能够实现多个数组的呈递报告-无论以on-screen 和printed 格式输出均不受限制。


    特征综述 About Feature


    XtraPivotGrid Suite Features:

    • Quickly Display Table Data into Fully Customizable Visual Reports
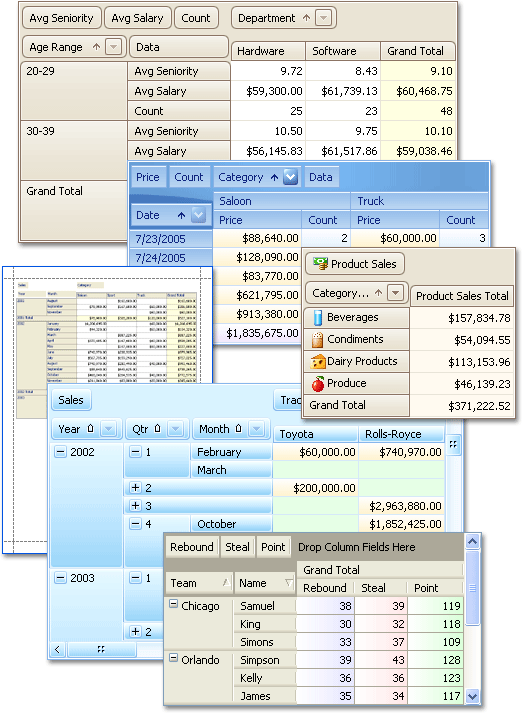
      The XtraPivotGrid Suite is the first component library of its kind for the .NET WindowsForms platform that allows your end users to slice and dice data in a manner similar to that found in MS Excel®. It has the power to convert hard to read and difficult to dissect dataset information into compact and summarized visual reports - making your applications far more usable and more effective at addressing your customer’s real-time business analysis needs. And just as importantly, with the XtraPivotGrid, users can easily change a report's layout visually in order to examine data from different/multiple perspectives. The benefits of this are two-fold - first, you never again have to foresee all possible report scenarios your end-users might require (saving you time and increasing your productivity) and second, your users will not have to deal with hard to use and overly complex reporting tools to answer their business questions.
    • Control the Level of Detail
      By default, the row and column axes contain each unique value in the source column. With the XtraPivotGrid, you can quickly simplify a report by merging values. For instance, you might have a report containing survey data in which the respondent's age represents an important characteristic. End-users may not want to browse through each and every unique age and instead want to see the ages of respondents in intervals such as 21-30, 31-40, etc. Instead of viewing sales by each unique date, they may want to view the sales for just the first few months. The axis can be customized in almost any fashion and the most common customizations need only a single property to be modified for its implementation!
    • Print and Render the XtraPivotGrid with Ease
      The XtraPivotGrid is NOT just about on-screen data analysis. With it, you can export data to numerous formats and render its contents to paper just like a traditional WYSIWYG report.
      • Printing support is available via the XtraPrinting Library (must be purchased separately).
      • Export to the XLS, XML, TXT, HTM and PDF.
      • Multi-cell selection and data export via the clipboard.
      • The XtraPivotGrid can be embedded into reports produced with the XtraReports Suite to create cross-tab reports.

       
    • Arrange Values Hierarchically - See Raw or Summarized Data in a Single Report
      Businesses have unique requirements and no two entities will analyze information in the same exact way. Your end-users may want to analyze sales for each product or each product category. They may want to view yearly data or see more detailed data by viewing the data for each month in a year. Using traditional reporting/database tools, you would often be forced to create a myriad of different reports to deliver the appropriate solution to your customers - but that’s no longer the case with the XtraPivotGrid. Since the visual control offers your end-users total runtime customization flexibility, not a single report layout needs to be modified to view data at different detail levels. You simply place fields at lower detail levels on the column or row area. Field values are automatically arranged into a tree structure with expandable parents. End-users are free to expand and collapse child groups to see more summarized or raw reports.
    • Automatic and Manually Specified Totals
      To improve the development experience, the XtraPivotGrid ensures your ability to deliver superior capabilities with minimal coding. Among the many features available in the component library is its ability to display grand totals for each row and column automatically. On the rare occasion that the built-in summary computation engine does not address a specific business requirement, you can display any number of totals for any value group.
    • Sort Data and Display Top Rows - Easily Access the Most Important Information
      The PivotGridControl automatically sorts row and column values so you can easily locate required data. Comprehensive data analysis, however, often requires a two-way approach to data navigation in that you may need to find data by a specific value or find a value by its data. To allow for the latter approach, the PivotGridControl introduces a unique feature - sorting values by their corresponding grand totals. This means the product you'll see first is not the one which starts with an A or Z, but rather the one that has the most or least sales. This of course is just the beginning to more effective and efficient data analysis. You can also specify the number of top rows that are displayed. So you can view a specific number of best-selling or worst-selling products for each year, month, customer, etc. You can concentrate on only the most important information and avoid being overload with a lot of surplus data.
    • Filter Data - Filter Out the Values Used to Calculate Summaries on the Fly
      As you’ve probably gathered, the XtraPivotGrid is unrivaled in its feature set and capabilities for the .NET Framework. Our goal was to radically simplify runtime data analysis and provide end-users with superior customization options. You will find that with its built-in visual filtering option, your end-users can manipulate reports on the fly using an easy to understand and familiar visual metaphor.
       
    • Hide unnecessary values in the axes.
      Yet another mechanism that allows end-users to focus only on the most important data.
    • Filter the data against which calculations are based.
      To allow your end-users manage this capability visually, the PivotGridControl has a Filter Panel Region. This pane was specifically designed to contain fields that aren't currently used in the report, and when required, can be dropped onto the report to automatically alter the base data used in the calculations.
    • Drill Down - Take a Look at the Data Behind a Summary
      The XtraPivotGrid is designed to transform table data into a summarized report. At the same time, it allows you to do the reverse. With just a single line of code, you can take a look at the records that were used to calculate cell values. With a few more lines of code, you can display this data within a standard DataGrid control, our advanced XtraGrid control or any other control designed for displaying table data. This feature brings complete data browsing flexibility within a single report - from different detail levels in a summarized report to the original raw data used to create the report itself. End-users are free to analyze every aspect and level of their data!